18/08/2010
A) Dust Echoes (http://www.abc.net.au/dustechoes/)
Very glad I brought my headphones to class today!
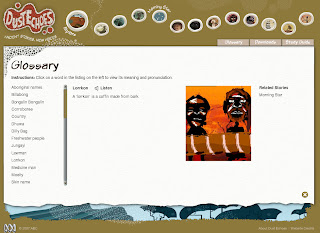
During the first part of our workshop, we explored the Dust Echoes website and I was amazed at what a powerful resource this was (are there more websites like this?). Dust Echoes was shown at the 2007 Melbourne International Film Festival, and contains beautiful animated movies about aboriginal Dreamtime stories. I’ve never seen animation quite like this before – the images were not necessarily the most advanced and lifelike, but were basic, vivid, and moving. I can see how this would be a great way to engage children at the start of a lesson, and wish I knew about this during the ‘All Aussie Adventures’ unit at my previous placement! This site not only contains animated interpretations of each story, but also has the original version of the story, a key-word glossary, and study guides (in PDF format) with suggestions of lesson plans to go with each movie. Amazing!
Our task was to select a film from Dust Echoes to create a storyboard, which to me seemed like a type of visual summary. We used our prior knowledge from Week 1’s lesson on Inspiration, and used the print screen function to capture defining moments in the movie (I chose ‘Morning Star’). We then pasted these images into Inspiration and created a visual storyboard. I think this would be a great exercise for students, as it not only helps them to practice summarising and the sequencing of events, but also shows the meaning they gathered from the story. For example, ‘Mermaid Story’ is a film without any words, so it would be very interesting to hear student’s interpretation of its meaning. They could do this by creating a storyboard on Inspiration, and could then read the original and compare their perceived meaning to the one the original story intended.
 |
| My 'Morning Star' Storyboard! |
Christine’s Classroom: Dust Echoes
I would be thrilled to use this in the classroom if it was relevant, but I think I’d have to take caution in my selection of movies to show. The one we watched in class, ‘Spear’, was quite graphic and maybe too powerful for early to middle primary. This is definitely a website that you’d want to carefully look through before showing it to students!
B) Microsoft Excel (http://www.m-ms.com/us/)
To be honest, this part of the session gave me quite the confidence boost! I’ve had a lot of experience with Excel, but I never knew a spreadsheet could look so… pretty.
 |
| My pretty graph :) |
We explored the M&M’s website and used it as a stimulus to gather data and information about the company. I was impressed with how detailed the website was, and can see how kids would be excited to read about the ‘unique personalities’ of each M&M’s colour (very clever). Although we were given the initial question (How many of each colour are within one bag of M&M’s?), there are many different routes you could go with this topic.
For instance, I began to look up the nutrition content and ingredients list, and found that the website contains a lot of information on this. It may not be as easy to find as some of the ‘more fun’ activities on the website, but the fact that it provides this information shows that you could turn this into a lesson that involves everything from maths to health. Who would have thought?
 |
| Delicious & Nutritious? Not quite... |
We experimented with using different types of graphs to present data, and I had a lot of fun selecting cells and filling them with colour to suit the topic we were exploring. We also labeled the graphs and I learned how to make the individual bars within a bar graph their own colour – very handy when comparing different coloured M&M’s!
Christine’s Classroom: Excel
I think Excel is a program that is targeted to upper primary and requires quite a bit of modeling on behalf of the teacher. After creating far too many spreadsheets in my last job, I was unaware of how this program could be used in a more creative (and colourful) way! I think that Excel would be great to use after students have had experience with graphs and have a good understanding of how graphs are used to represent information. I think just getting students to find the numbers and entering them into Excel would not encourage a deeper understanding of this area in maths.


No comments:
Post a Comment